
This month, I presented the Clinical Trial Risk Tool at the Plotly Dash in Action webinar. I was interviewed by Plotly’s Community Manager Adam Schroeder. You can watch the relevant part of the webinar below.
The Clinical Trial Risk Tool was one of four interactive apps presented as part of the webinar. The speakers at the webinar were:
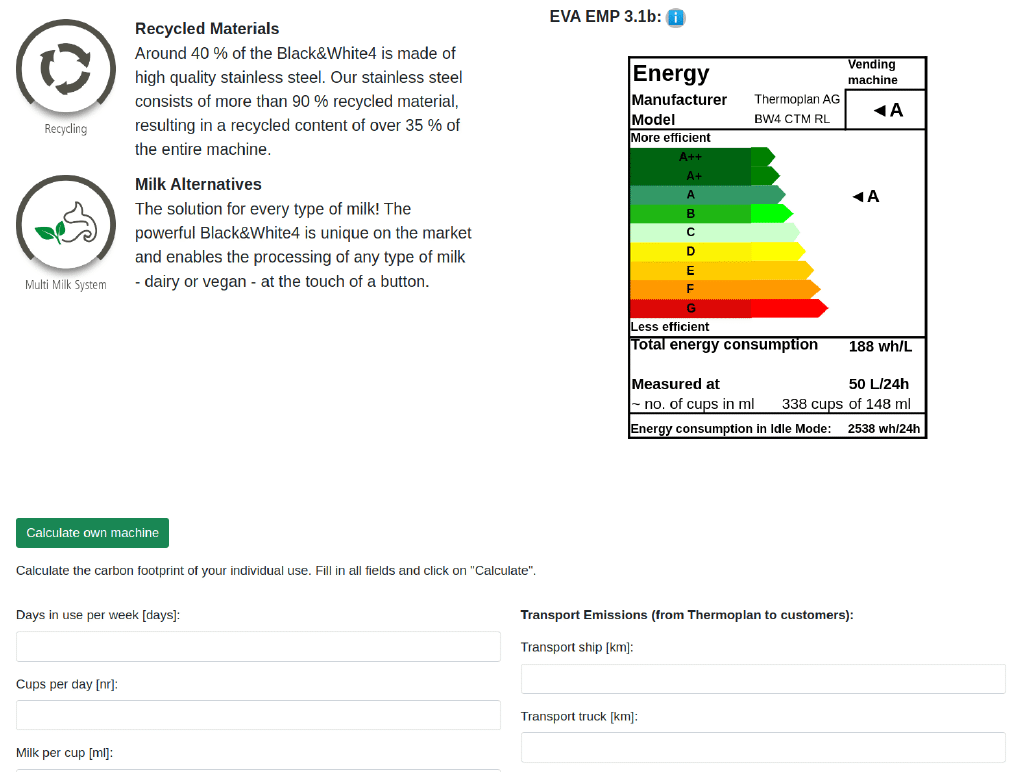
Screenshot of Matteo Trachsel’s Thermoplan dashboard which calculates the carbon footprint of coffee machine usage.
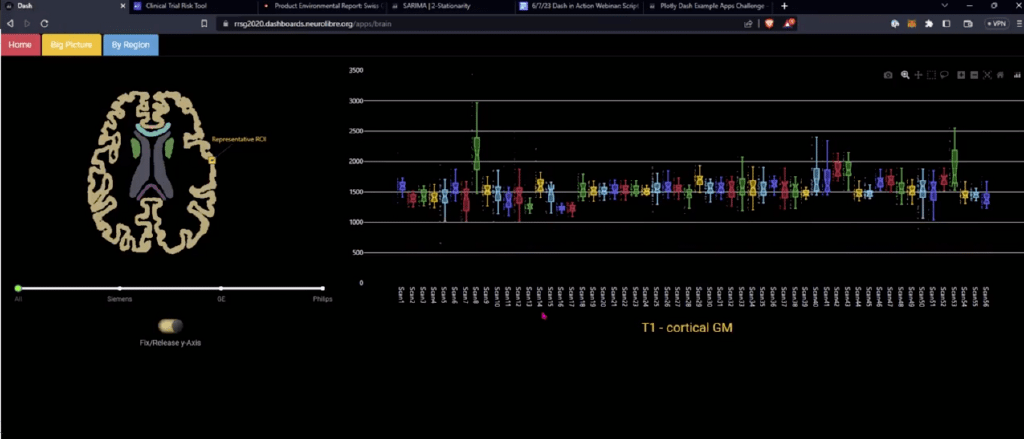
Screenshot of Agah Karakuzu’s dashboard which allows neuroscientists to assess the reproducibility of T1 values across different sites and vendors where researchers used the same research protocol. (T1 is the time it takes water molecules in the brain to return to their original state following a magnetic pulse).
If you would like to cite the tool alone, you can cite:
Wood TA and McNair D. Clinical Trial Risk Tool: software application using natural language processing to identify the risk of trial uninformativeness. Gates Open Res 2023, 7:56 doi: 10.12688/gatesopenres.14416.1.
A BibTeX entry for LaTeX users is
@article{Wood_2023, doi = {10.12688/gatesopenres.14416.1}, url = {https://doi.org/10.12688%2Fgatesopenres.14416.1}, year = 2023, month = {apr}, publisher = {F1000 Research Ltd}, volume = {7}, pages = {56}, author = {Thomas A Wood and Douglas McNair}, title = {Clinical Trial Risk Tool: software application using natural language processing to identify the risk of trial uninformativeness}, journal = {Gates Open Research} }

Estimating the total cost of a clinical trial before it runs is challenging. Public data on past trial costs can be hard to come by, as many companies guard this information carefully. Trials in high income countries and low and middle income countries have very different costs. Upload your clinical trial protocol and create a cost benchmark with AI Protocol to cost benchmark The Clinical Trial Risk Tool uses AI and Natural Language Processing (NLP) to estimate the cost of a trial using the information contained in the clinical trial protocol.
You can download a white paper about clinical trial cost benchmarking here Estimating the total cost of a clinical trial before it runs is challenging. Public data on past trial costs can be hard to come by, as many companies guard this information carefully. Trials in high income countries and low and middle income countries have very different costs. Clinical trial costs are not normally distributed.[1] I took a dataset of just over 10,000 US-funded trials.

Guest post by Safeer Khan, Lecturer at Department of Pharmaceutical Sciences, Government College University, Lahore, Pakistan Introduction The success of clinical studies relies heavily on proper financial planning and budgeting. These processes directly impact key factors such as project timelines, resource allocation, and compliance with regulatory requirements. The accurate forecasting of costs for clinical trials, however, is a highly complex and resource-intensive process. A study by the Tufts Center for the Study of Drug Development found that the average cost of developing a new drug is approximately $2.