
You can download a white paper about clinical trial cost benchmarking here
Estimating the total cost of a clinical trial before it runs is challenging. Public data on past trial costs can be hard to come by, as many companies guard this information carefully. Trials in high income countries and low and middle income countries have very different costs.
Clinical trial costs are not normally distributed.[1] I took a dataset of just over 10,000 US-funded trials. You can see that the range is huge, from small device or behavioural trials costing as little as $50,000, while large multi-centre international trials can cost hundreds of millions. This means that modelling trial costs is extremely challenging. Tools like linear regression will not work out of the box - any model will be swamped by effects from outliers.
Above: histogram of clinical trial costs. You can see the distribution has an extreme long tail.
Fortunately, a log transform of trial costs does bring you to a more manageable distribution.

Above: histogram of clinical trial costs after log transformation. At this point the distribution resembles a bell curve, which means that log costs should be easier to model.
Further challenges to modelling costs come from the fact that there are so many variables. For example, every condition and drug could be in effect their own input variable to a regression model.
Industry funded studies have reported average costs of bringing new drugs to the market of $802M-$2.6B.[2,3,4] A review of 726 studies in 2016 found that the median cost of a Phase 1 clinical trial was $3.4M, with $8.6M for Phase 2 and $21.4M for Phase 3.[5] These reported numbers are useful to an extent for benchmarking, but when the variance within a phase spans multiple orders of magnitude, we need to be more precise.
What use would a mean or median value be when the distribution of values in that class is so extreme (like in my histogram above)?
I would define cost benchmarking as modelling trial costs according to what different companies have spent on comparable trials. It is useful for a trial sponsor to model trial costs both in relation to past trials that they have funded, and also trials that competitors have funded. The latter concept is what I am terming “cost benchmarking”.
The Clinical Trial Risk Tool now provides a cost benchmarking functionality. The benchmark function uses public domain data on costs of past trials, and we use AI and natural language processing to find trials with similar inclusion criteria, interventions, conditions, and design to your trial. The most similar past trials are factored to create a prediction and a range.
Costs from past trials are inflation-adjusted upwards by 3%,[1] so inputs to the model from older trials are still relevant.
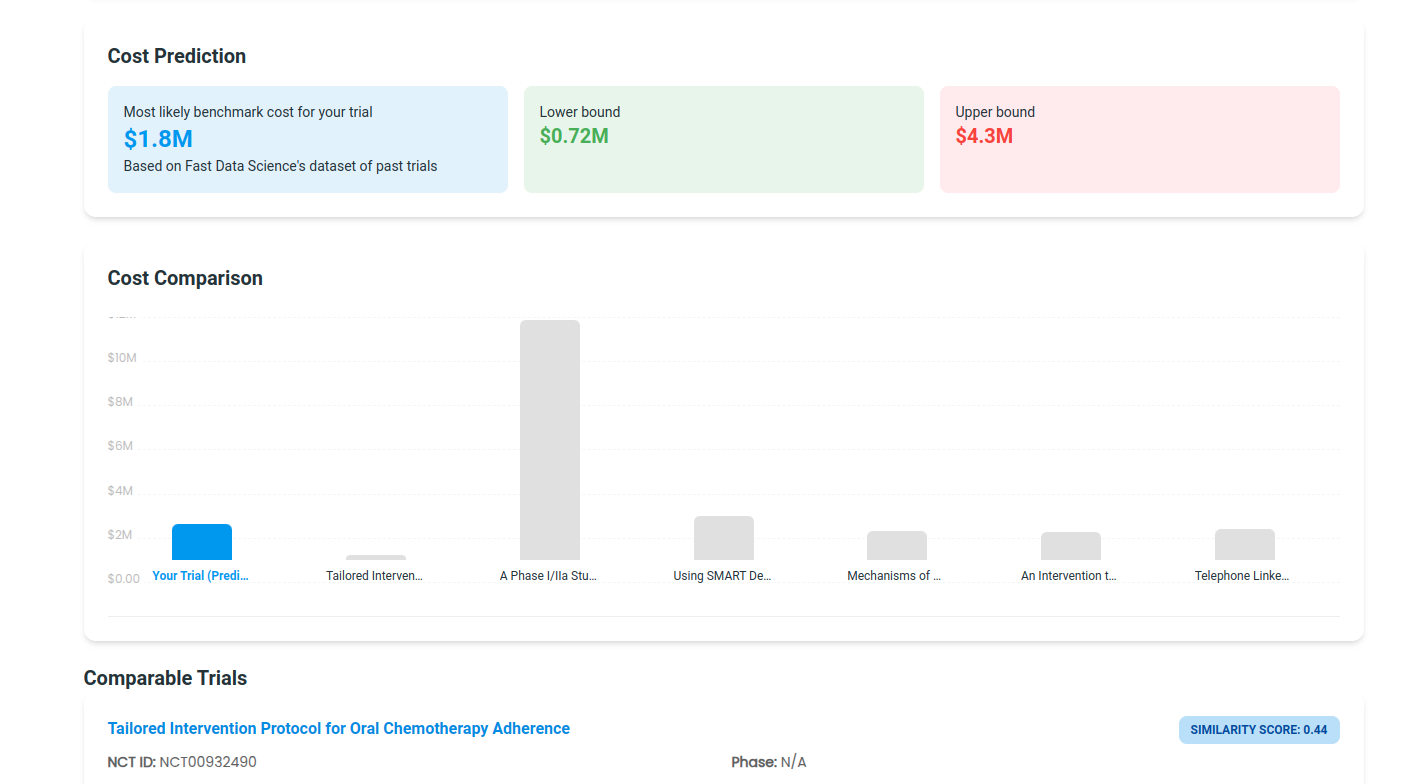
The tool displays the estimated cost, a lower and upper bound, and the past trials that the cost estimate was based on.
Find out about trial cost benchmarking
Below you can see a summary of the cost distributions of our clinical trial dataset by phase.

Going back to the linear scale (without the log 10 transformation), you can see that the skew of the cost distribution is particularly high in Phase 1, making Phase 1 (somewhat surprisingly) one of the hardest to model. For all phases, the median is very different from the mean.
| Phase | N | Mean cost | Median cost | Standard deviation | Skew | |
|---|---|---|---|---|---|---|
| 0 | Early Phase 1 | 134 | $1,351,000 | $816,000 | $1,597,000 | 4.14 |
| 1 | Phase 1 | 616 | $2,419,000 | $984,000 | $4,035,000 | 5.81 |
| 2 | Phase 1/Phase 2 | 298 | $2,733,000 | $1,135,000 | $4,529,000 | 3.33 |
| 3 | Phase 2 | 1045 | $2,205,000 | $1,459,000 | $3,035,000 | 5.71 |
| 4 | Phase 2/Phase 3 | 174 | $2,803,000 | $1,844,000 | $4,375,000 | 5.41 |
| 5 | Phase 3 | 524 | $4,328,000 | $2,515,000 | $6,204,000 | 3.45 |
| 6 | Phase 4 | 413 | $2,391,000 | $1,766,000 | $2,787,000 | 4.67 |
Moving back to the log10 scale, Phase 1 and Phase 1/Phase 2 have the highest skews.
| Phase | N | Mean log10 cost | Median log10 cost | Standard deviation | Skew | |
|---|---|---|---|---|---|---|
| 0 | Early Phase 1 | 134 | 5.95 | 5.91 | 0.39 | 0.17 |
| 1 | Phase 1 | 616 | 6.08 | 5.99 | 0.5 | 0.24 |
| 2 | Phase 1/Phase 2 | 298 | 6.09 | 6.05 | 0.52 | 0.45 |
| 3 | Phase 2 | 1045 | 6.12 | 6.16 | 0.43 | -0.01 |
| 4 | Phase 2/Phase 3 | 174 | 6.21 | 6.27 | 0.45 | -0.21 |
| 5 | Phase 3 | 524 | 6.37 | 6.4 | 0.48 | -0.21 |
| 6 | Phase 4 | 413 | 6.2 | 6.25 | 0.4 | -0.18 |
In addition to cost benchmarking, you can model a trial cost, by identifying all activities associated with the trial (such as the assessments in the schedule of events), and sum these items to create a budget. This is complex and time consuming, but creates an itemised budget. The Clinical Trial Risk Tool allows you to build a site budget directly from the protocol PDF.
Above: the Clinical Trial Risk Tool lets you upload a protocol and will automatically check the protocol design against its checklist, as well as generating a site budget for you.
Upload your clinical trial protocol and create a budget with AI
Range:

Estimating the total cost of a clinical trial before it runs is challenging. Public data on past trial costs can be hard to come by, as many companies guard this information carefully. Trials in high income countries and low and middle income countries have very different costs. Upload your clinical trial protocol and create a cost benchmark with AI Protocol to cost benchmark The Clinical Trial Risk Tool uses AI and Natural Language Processing (NLP) to estimate the cost of a trial using the information contained in the clinical trial protocol.

Guest post by Safeer Khan, Lecturer at Department of Pharmaceutical Sciences, Government College University, Lahore, Pakistan Introduction The success of clinical studies relies heavily on proper financial planning and budgeting. These processes directly impact key factors such as project timelines, resource allocation, and compliance with regulatory requirements. The accurate forecasting of costs for clinical trials, however, is a highly complex and resource-intensive process. A study by the Tufts Center for the Study of Drug Development found that the average cost of developing a new drug is approximately $2.

Guest post by Safeer Khan, Lecturer at Department of Pharmaceutical Sciences, Government College University, Lahore, Pakistan Introduction Recent years have seen a substantial rise in oncology clinical trials, with annual growth exceeding 260 studies on average [1]. Despite this increase, these studies continue to be some of the most demanding and resource-intensive in clinical research. The combination of intensive monitoring, detailed assessment schedules, and highly specific eligibility criteria creates substantial operational challenges.