How can you use the Clinical Trial Risk Tool to create a per-subject budget from a protocol or synopsis and a site Charge Master? The video below walks you through how the Clinical Trial Risk Tool by Fast Data Science can accelerate your budgeting.
The Clinical Trial Risk Tool streamlines the creation of a per-subject budget by automating the typically manual process of extracting data from the Study Protocol and cross-referencing it with Charge Master/Fee Schedules.
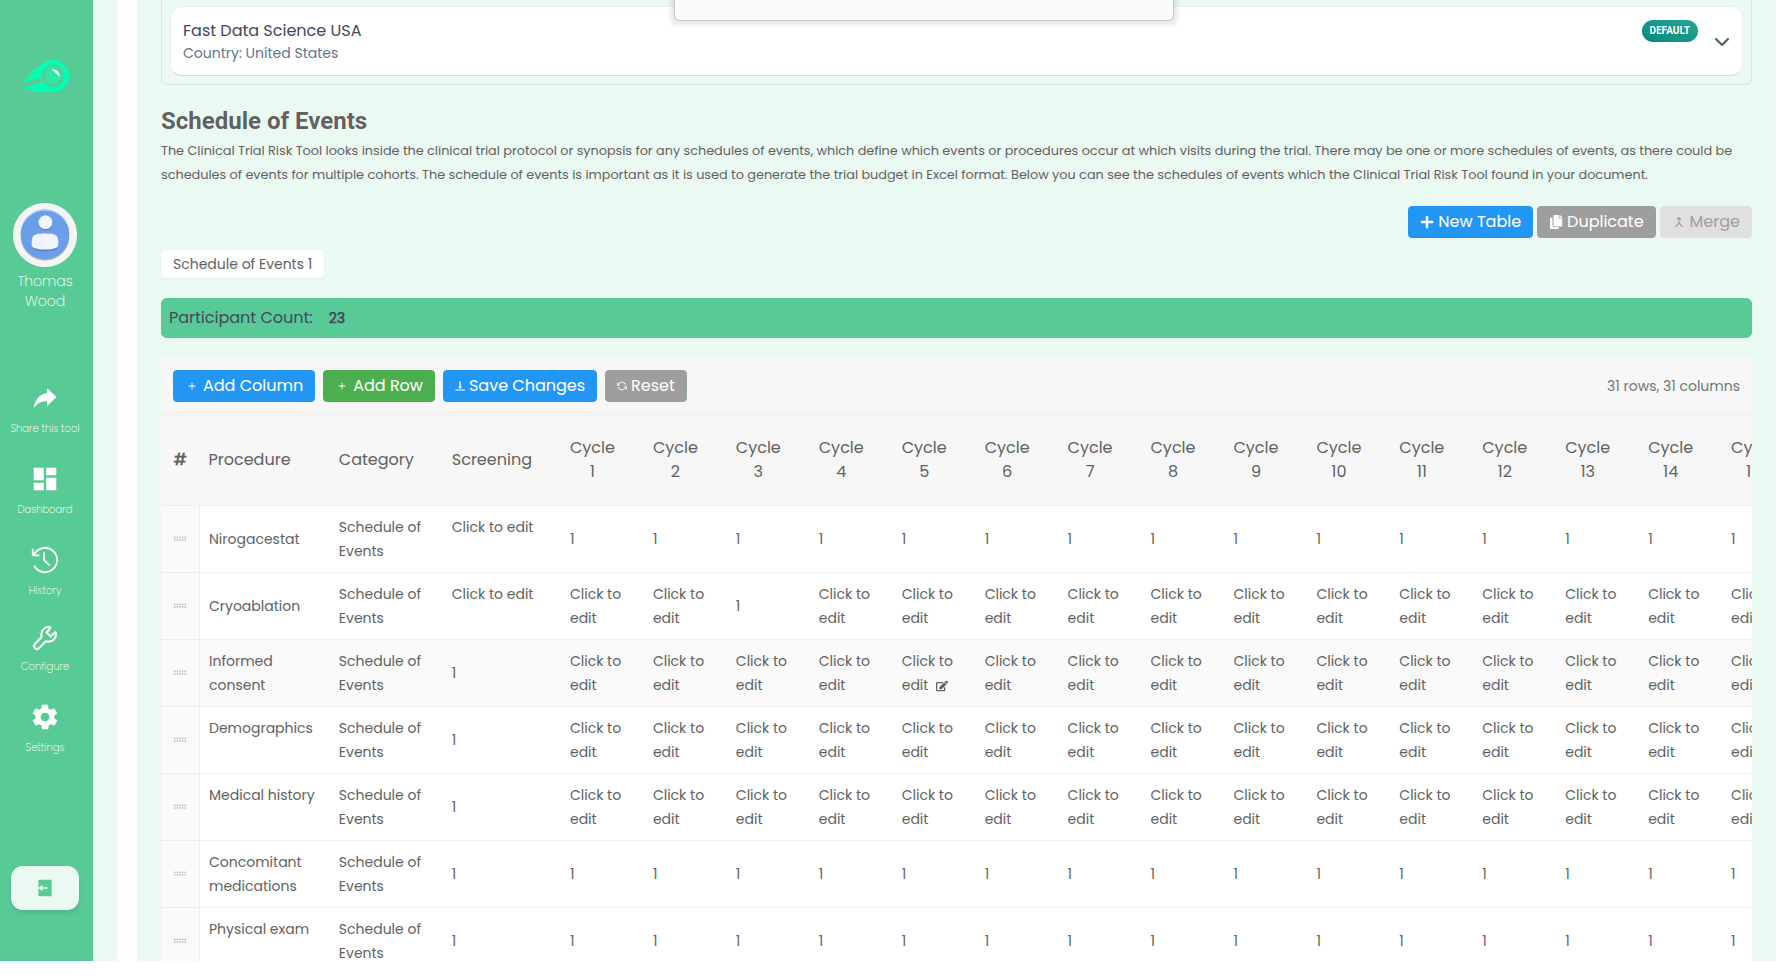
The tool focuses on the Schedule of Events table within the study protocol. This table is critical because it lists every procedure and assessment (Y-axis) and specifies the visit (X-axis) at which each will take place (often marked with an “X”). The tool pulls out this table data from the PDF protocol, overcoming the need for manual transcription.
Once the procedures and the relevant visits are identified, the tool uses the Charge Master/Schedule of Procedure Fees which the user has selected. The Charge Master contains the local codes and costs for various procedures. The tool cross-references the procedures identified in the Schedule of Events with their associated costs in the Charge Master, using generative AI (vector similarity).
By matching the required study procedures with their local costs, the tool can fill out an itemised budget (e.g., cost of vital signs, lab procedures, blood draws, etc.) for each patient visit, ultimately compiling the total per-subject budget.
You can also check out our recent White Paper.
How does the tool work? https://clinicaltrialrisk.org/clinical-trial-protocol-software/create-clinical-trial-budget-from-synopsis/
More about Fast Data Science: https://fastdatascience.com/

Estimating the total cost of a clinical trial before it runs is challenging. Public data on past trial costs can be hard to come by, as many companies guard this information carefully. Trials in high income countries and low and middle income countries have very different costs. Upload your clinical trial protocol and create a cost benchmark with AI Protocol to cost benchmark The Clinical Trial Risk Tool uses AI and Natural Language Processing (NLP) to estimate the cost of a trial using the information contained in the clinical trial protocol.
You can download a white paper about clinical trial cost benchmarking here Estimating the total cost of a clinical trial before it runs is challenging. Public data on past trial costs can be hard to come by, as many companies guard this information carefully. Trials in high income countries and low and middle income countries have very different costs. Clinical trial costs are not normally distributed.[1] I took a dataset of just over 10,000 US-funded trials.

Guest post by Safeer Khan, Lecturer at Department of Pharmaceutical Sciences, Government College University, Lahore, Pakistan Introduction The success of clinical studies relies heavily on proper financial planning and budgeting. These processes directly impact key factors such as project timelines, resource allocation, and compliance with regulatory requirements. The accurate forecasting of costs for clinical trials, however, is a highly complex and resource-intensive process. A study by the Tufts Center for the Study of Drug Development found that the average cost of developing a new drug is approximately $2.