We have improved the Clinical Trial Risk Tool in the last 6 months, making it more user friendly and taking on board the feedback that we’ve received. We’ve improved the accuracy of the machine learning components too.
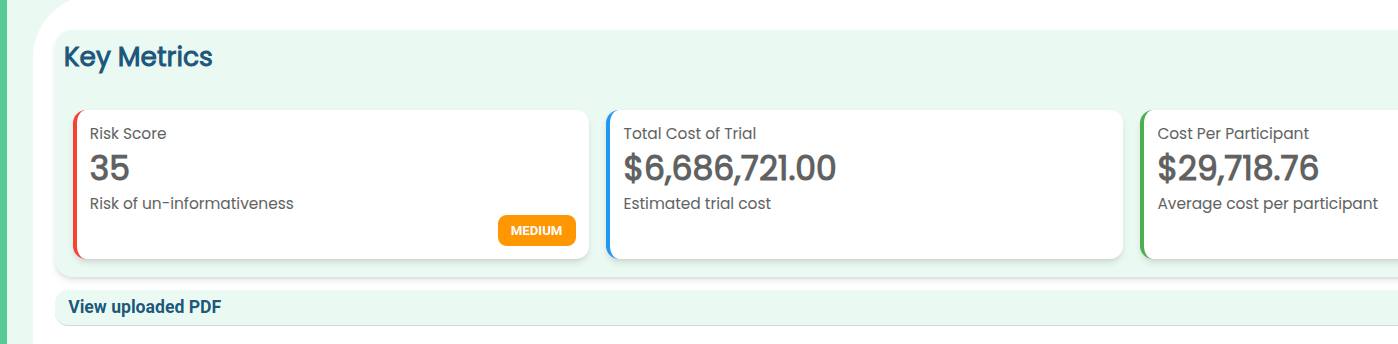
The tool now outputs its key figures such as risk levels and estimated cost in easily readable cards, so you can see at a glance the key takeaways from your protocol:
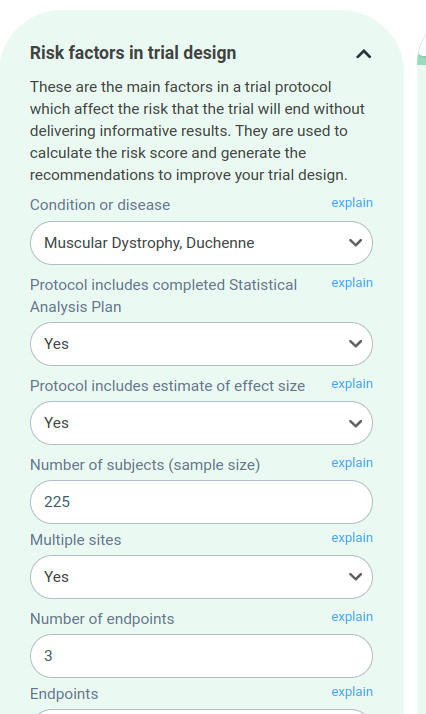
The risk factors are now organised into collapsible categories, so you can explore them easily without an information overload.
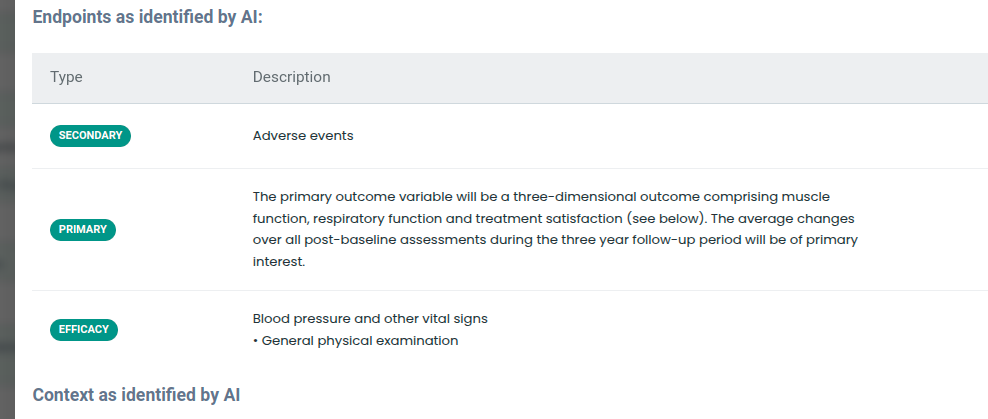
The tool identifies endpoints and inclusion and exclusion criteria. In future, we are hoping to use this to retrieve trials with comparable endpoints or criteria from the registries such as ClinicalTrials.gov.
Check your trial design
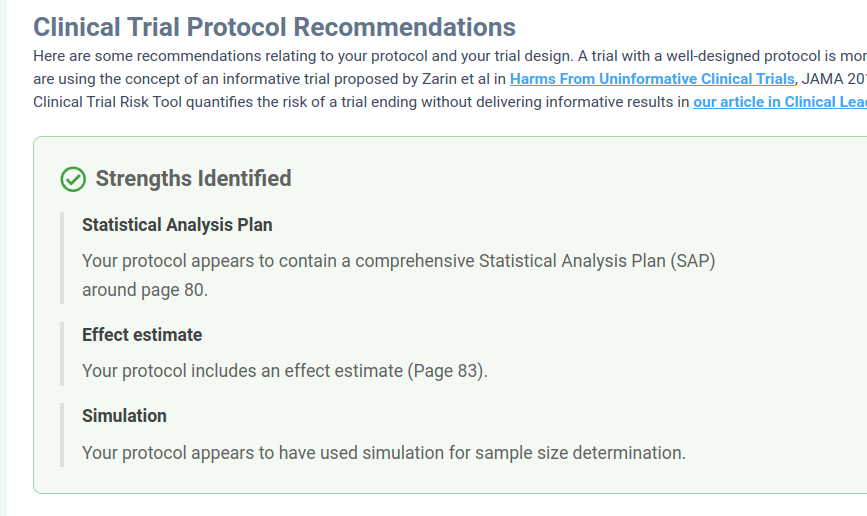
We have an easily digestible set of recommendations for the user to improve the trial, so you can see what are the high priority actions that you need to take with your protocol.
Currently we’re working on a feature to allow the user to generate an itemised budget for the trial in Excel from the schedule of events. We expect this to take a few months and to be finished in Q4 of 2025.
We are also working on making the tool output the probability of success for the trial. A number of groups have calculated aggregate statistics around trials proceeding from Phase 1->Phase 2, or Phase 3->approval, etc, e.g. MIT’s Project Alpha or Chufan Gao, Automatically Labeling Clinical Trial Outcomes, so these statistics or machine learning models could be integrated into the tool, and in addition to outputting the “risk score” it could also output the “probability of success” or similar, based on past trials.
We hope to also produce an accountable budget range (where should a reasonable bid fall), based on past trials.
Gao, Chufan, et al. Automatically Labeling Clinical Trial Outcomes: A Large-Scale Benchmark for Drug Development. arXiv preprint arXiv:2406.10292 (2024).
Shomesh Chaudhuri, Joonhyuk Cho, Andrew W. Lo, Manish Singh, and Chi Heem Wong, Debiasing Probability of Success Estimates for Clinical Trials (2022)

Estimating the total cost of a clinical trial before it runs is challenging. Public data on past trial costs can be hard to come by, as many companies guard this information carefully. Trials in high income countries and low and middle income countries have very different costs. Upload your clinical trial protocol and create a cost benchmark with AI Protocol to cost benchmark The Clinical Trial Risk Tool uses AI and Natural Language Processing (NLP) to estimate the cost of a trial using the information contained in the clinical trial protocol.
You can download a white paper about clinical trial cost benchmarking here Estimating the total cost of a clinical trial before it runs is challenging. Public data on past trial costs can be hard to come by, as many companies guard this information carefully. Trials in high income countries and low and middle income countries have very different costs. Clinical trial costs are not normally distributed.[1] I took a dataset of just over 10,000 US-funded trials.

Guest post by Safeer Khan, Lecturer at Department of Pharmaceutical Sciences, Government College University, Lahore, Pakistan Introduction The success of clinical studies relies heavily on proper financial planning and budgeting. These processes directly impact key factors such as project timelines, resource allocation, and compliance with regulatory requirements. The accurate forecasting of costs for clinical trials, however, is a highly complex and resource-intensive process. A study by the Tufts Center for the Study of Drug Development found that the average cost of developing a new drug is approximately $2.