
Natural language processing is becoming ever more important in research. The explosion in interest in LLMs is sparking many opportunities to analyse text data in healthcare, social sciences, and other areas.
We’re proud to announce that the Clinical Trial Risk Tool has been selected as a winner of the Plotly Dash Example Apps Challenge (2023), out of 25 amazing apps submitted by the community.
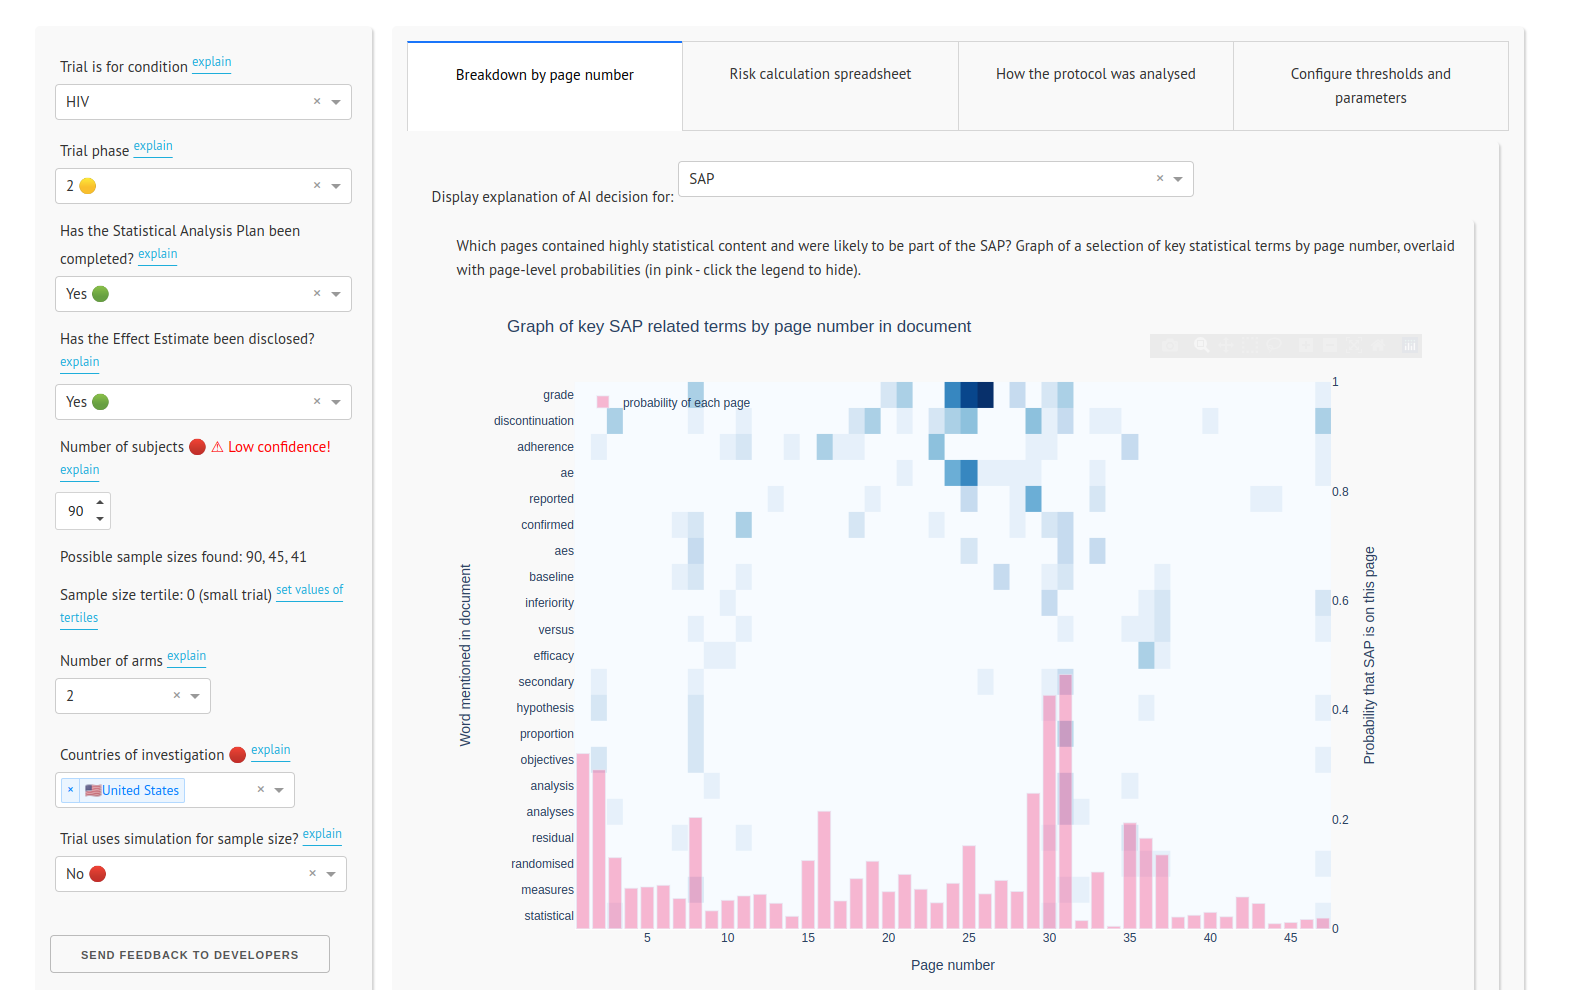
Funded by the Bill and Melinda Gates Foundation, this app uses natural language processing, Plotly Dash, and the spaCy and Scikit-Learn libraries to calculate the risk of a clinical trial failing to deliver informative results. It reads the trial protocol and identifies key features from the text which are fed into a risk model.
You can try the new version of the app at: https://clinicaltrialrisk.org/tool

Estimating the total cost of a clinical trial before it runs is challenging. Public data on past trial costs can be hard to come by, as many companies guard this information carefully. Trials in high income countries and low and middle income countries have very different costs. Upload your clinical trial protocol and create a cost benchmark with AI Protocol to cost benchmark The Clinical Trial Risk Tool uses AI and Natural Language Processing (NLP) to estimate the cost of a trial using the information contained in the clinical trial protocol.
You can download a white paper about clinical trial cost benchmarking here Estimating the total cost of a clinical trial before it runs is challenging. Public data on past trial costs can be hard to come by, as many companies guard this information carefully. Trials in high income countries and low and middle income countries have very different costs. Clinical trial costs are not normally distributed.[1] I took a dataset of just over 10,000 US-funded trials.

Guest post by Safeer Khan, Lecturer at Department of Pharmaceutical Sciences, Government College University, Lahore, Pakistan Introduction The success of clinical studies relies heavily on proper financial planning and budgeting. These processes directly impact key factors such as project timelines, resource allocation, and compliance with regulatory requirements. The accurate forecasting of costs for clinical trials, however, is a highly complex and resource-intensive process. A study by the Tufts Center for the Study of Drug Development found that the average cost of developing a new drug is approximately $2.