
We have developed a tool allowing researchers to analyse HIV and TB Clinical Trial Protocols and identify risk factors using Natural Language Processing. The tool allows a user to upload a clinical trial protocol in PDF format, and the tool will generate a risk assessment of the trial. You can find example protocols by searching on ClinicalTrials.gov.
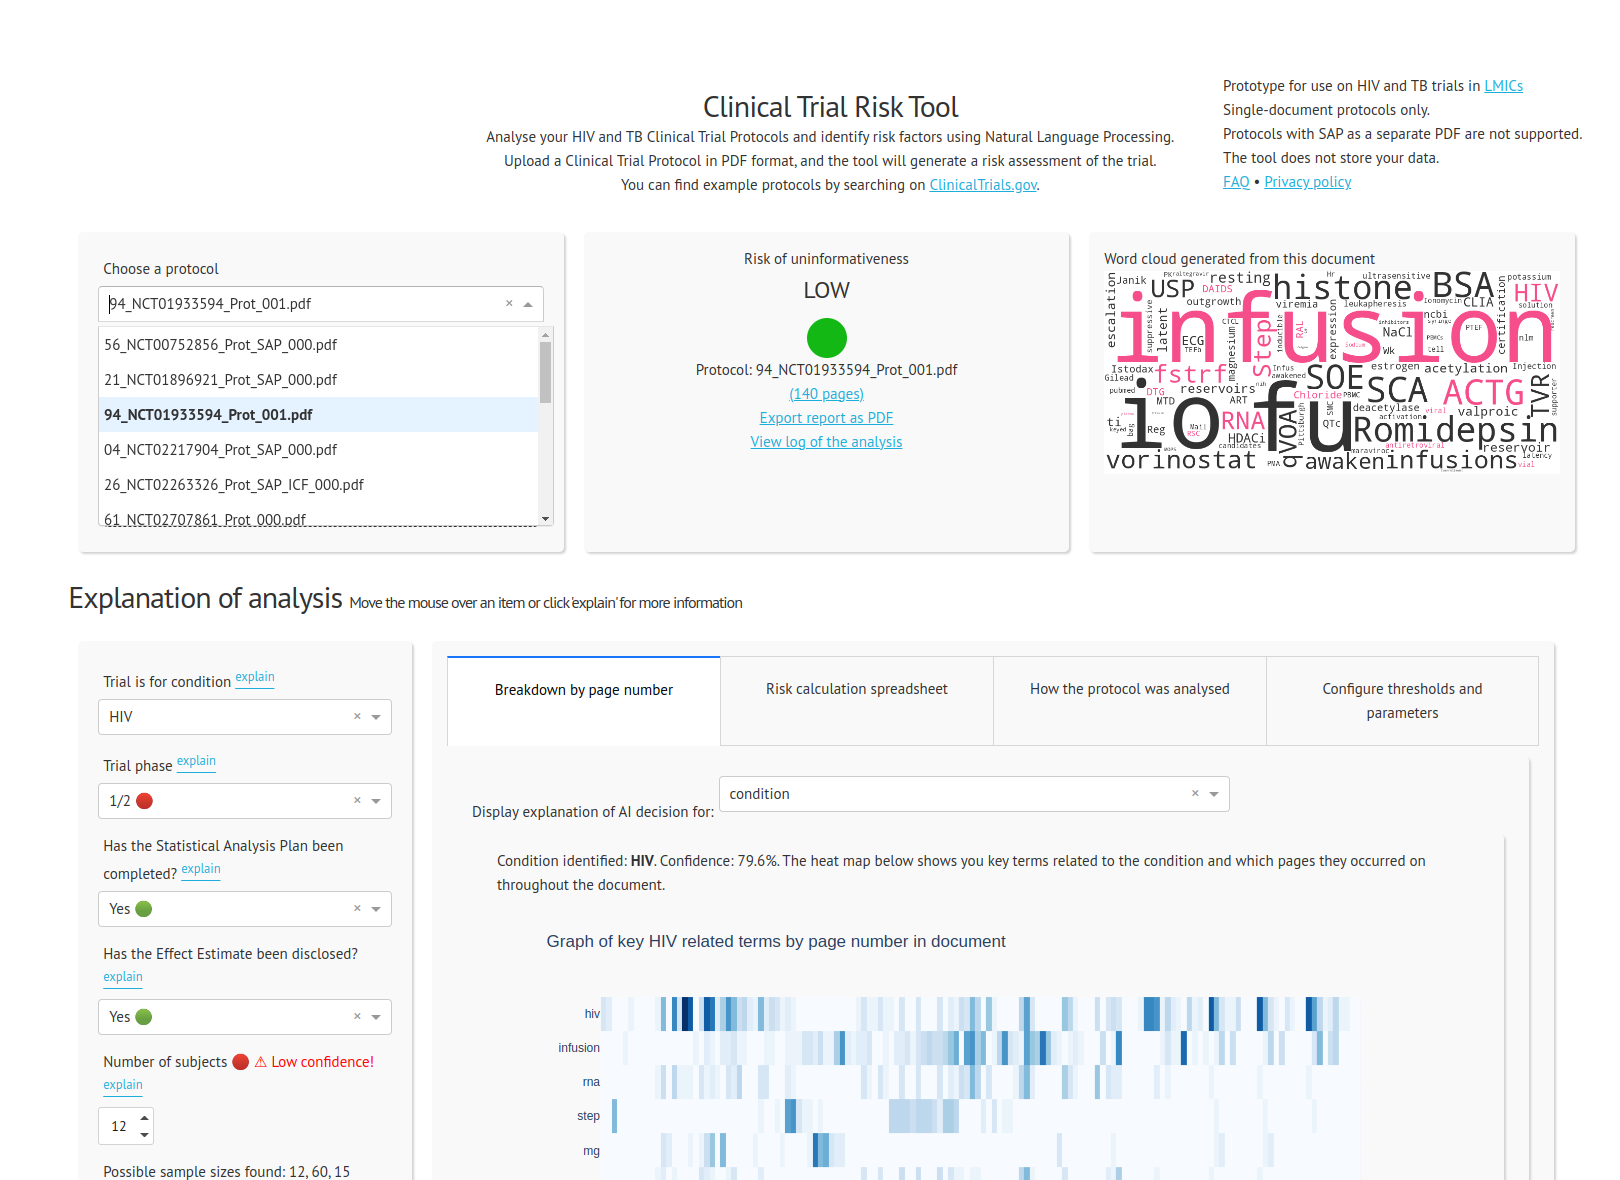
The tool allows a user to upload a trial protocol in PDF format. The tool processes the PDF into plain text and identifies features which indicate high or low risk of uninformativeness.
At present the tool supports the following features:
The features are then passed into a scoring formula which scores the protocol from 0 to 100, and then the protocol is flagged as HIGH, MEDIUM or LOW risk.
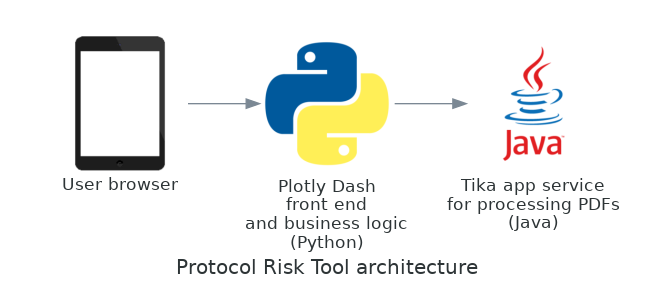
The Protocol Analysis Tool runs on Python and requires or uses the packages Plotly Dash, Scikit-Learn, SpaCy and NLTK. The tool runs as a web app in the user’s browser. It is developed as a Docker container and it has been deployed to the cloud as a Microsoft Azure Web App.
PDFs are converted to text using the library Tika, developed by Apache.
All third-party components are open source and there are no closed source dependencies.
A list of the accuracy scores of the various components is provided here.
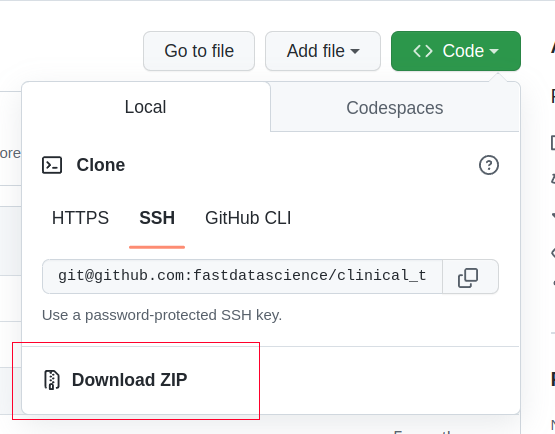
Download this repository from the Github link as in the below screenshot, and unzip it on your computer
Alternatively if you are using Git in the command line,
Now you have the source code. You can edit it in your favourite IDE, or alternatively run it with Docker:
front_end. Run the command: docker-compose up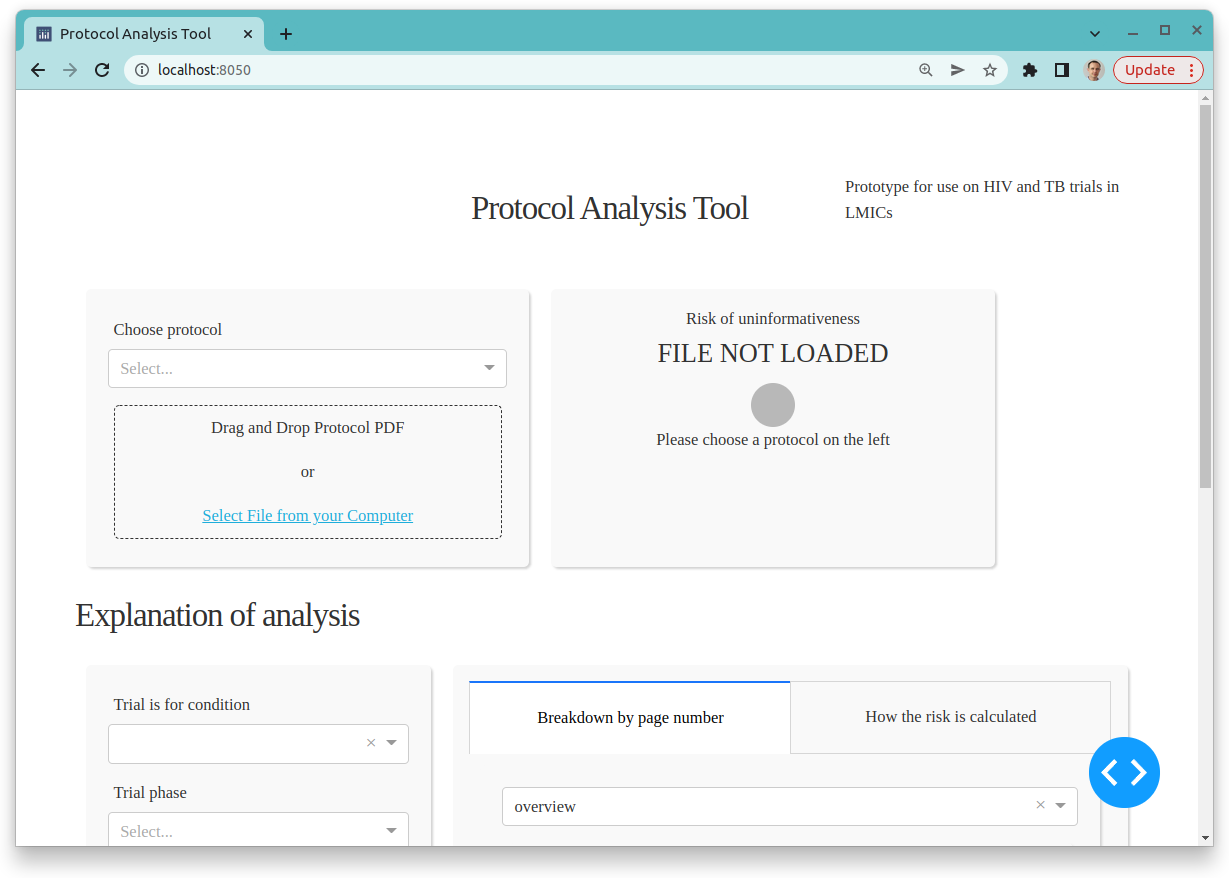
Each parameter is identified in the document by a stand-alone component. The majority of these components use machine learning but three (Phase, Number of Subjects and Countries) use a combined rule-based + machine learning ensemble approach. For example, identifying phase was easier to achieve using a list of key words and phrases, rather than a machine learning approach.
The default sample size tertiles were derived from a sample of 21 trials in LMICs, but have been rounded and manually adjusted based on statistics from ClinicalTrials.gov data.
The tertiles were first calculated using the training dataset, but in a number of phase and pathology combinations the data was too sparse and so tertile values had to be used from ClinicalTrials.gov. The ClinicalTrials.gov data dump was used from 28 Feb 2022.
Future development work on this project could include:
We have identified the potential for natural language processing to extract data from protocols at BMGF. Both machine learning and rule-based methods have a huge potential for this problem, and machine learning models wrapped inside a user-friendly GUI make the power of AI evident and accessible to stakeholders throughout the organisation.
With the protocol analysis tool, it is possible to explore protocols and systematically identify risk factors very quickly.

Estimating the total cost of a clinical trial before it runs is challenging. Public data on past trial costs can be hard to come by, as many companies guard this information carefully. Trials in high income countries and low and middle income countries have very different costs. Upload your clinical trial protocol and create a cost benchmark with AI Protocol to cost benchmark The Clinical Trial Risk Tool uses AI and Natural Language Processing (NLP) to estimate the cost of a trial using the information contained in the clinical trial protocol.
You can download a white paper about clinical trial cost benchmarking here Estimating the total cost of a clinical trial before it runs is challenging. Public data on past trial costs can be hard to come by, as many companies guard this information carefully. Trials in high income countries and low and middle income countries have very different costs. Clinical trial costs are not normally distributed.[1] I took a dataset of just over 10,000 US-funded trials.

Guest post by Safeer Khan, Lecturer at Department of Pharmaceutical Sciences, Government College University, Lahore, Pakistan Introduction The success of clinical studies relies heavily on proper financial planning and budgeting. These processes directly impact key factors such as project timelines, resource allocation, and compliance with regulatory requirements. The accurate forecasting of costs for clinical trials, however, is a highly complex and resource-intensive process. A study by the Tufts Center for the Study of Drug Development found that the average cost of developing a new drug is approximately $2.