A number of documents are needed to produce a complete and accurate clinical trial budget. The necessary documents typically include:
However, sometimes a sponsor will send only the synopsis to a CRO when requesting a quote.
If you work for the CRO and you have received a synopsis, how can you create a detailed budget?
This can be challenging because you don’t have all the information needed. However, we can make some progress towards a rough budget.
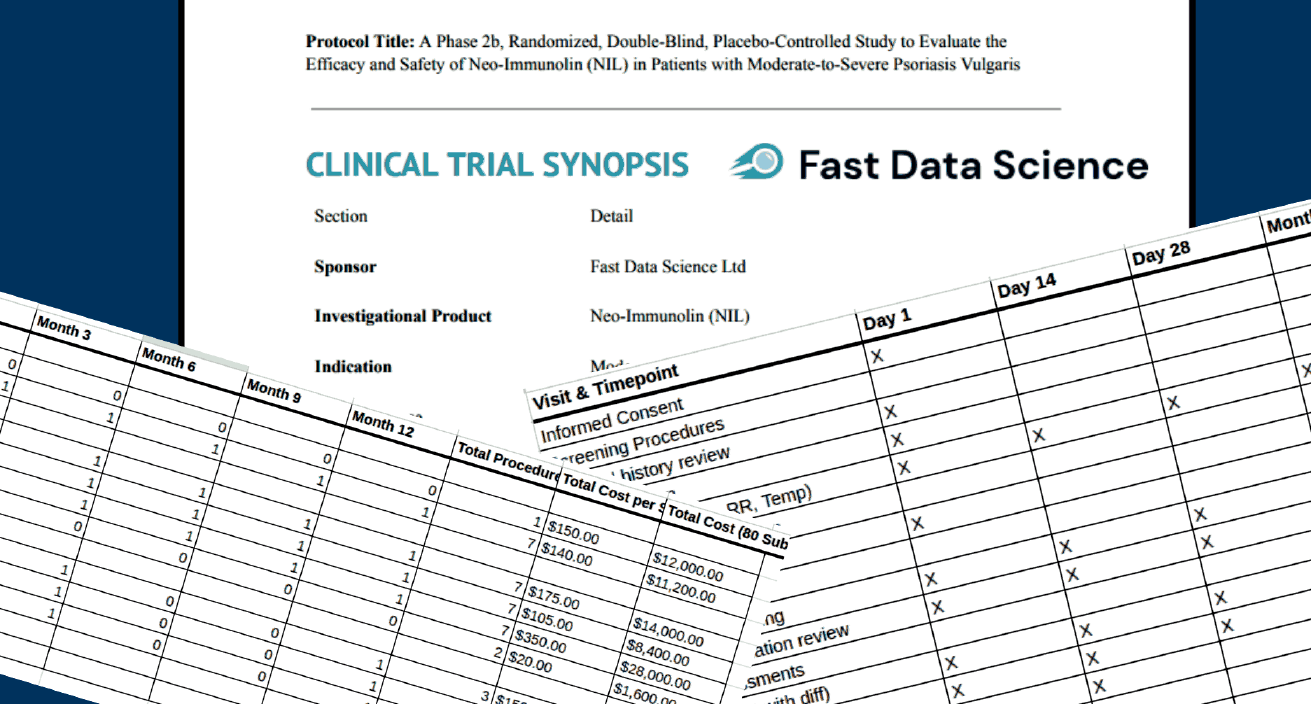
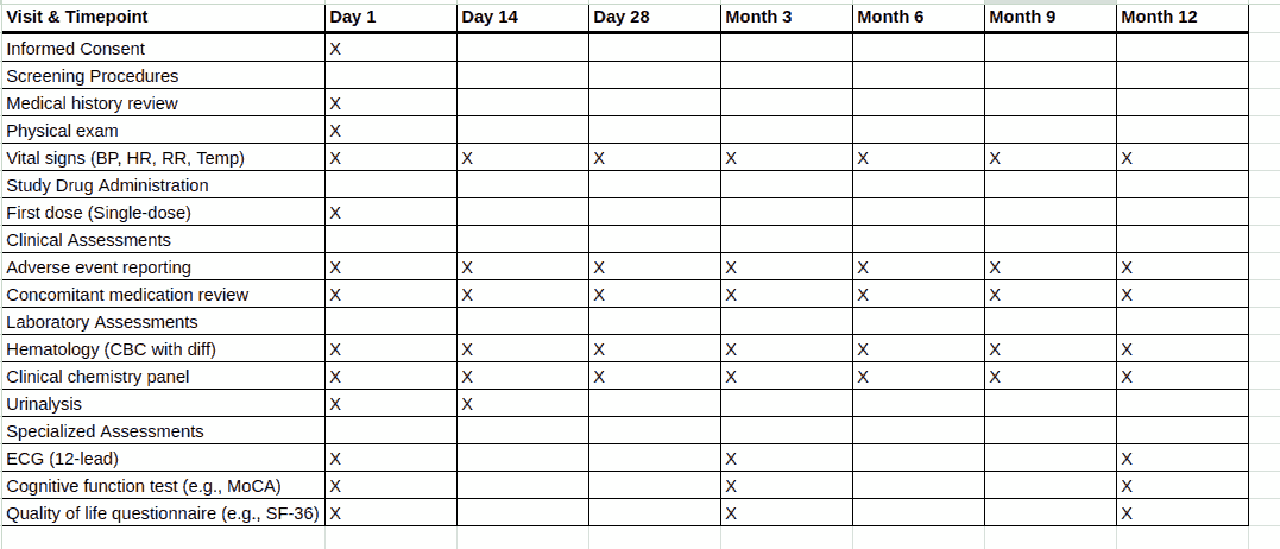
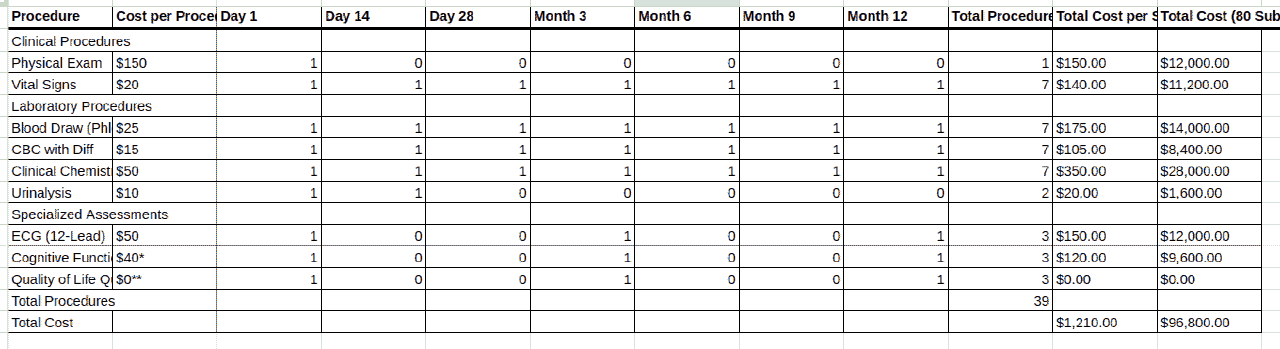
The most important information needed to create a clinical trial budget is the schedule of events, which is a table or list of tables which will be found in the protocol and generally also in the synopsis. The schedule of events lists all the study visits from the screening to the final visit. Below is an example of a schedule of events. You can drag the slider to see how this schedule of events might be transformed into a per-subject budget.
If you have the synopsis for the trial, you can locate the schedule of events and find all the procedures listed in the schedule of events. You may or may not have a charge master from the sponsor, but you can use a general charge master for the trial country and location. For example, European countries tend to have single payer healthcare systems where the charge master is in the public domain, such as the National Health Service’s interactive Costing Tool in the UK or the GOÄ in Germany.
You would then go through the schedule of events and match the descriptions of the procedures in the schedule of events to items in the charge master. You should look up the costs and attempt to assemble a budget with the information that you have.
Information around the fixed costs is possibly going to be more challenging if you do not have details from the sponsor over what exactly will be paid for by which party. For example, you don’t know which procedures need to be carried out by nurses, doctors, or admin staff. The schedule of events in the protocol will also come with footnotes detailing additional information, such as how many lab procedures need to be undertaken, and this information may be missing from the synopsis.
The informed consent form includes information about subject compensation. If you only have the synopsis and no informed consent form, then this information will be missing and you will need to infer it.
In short, if you have only the synopsis of the clinical trial, then your budget will be incomplete and contains some caveats. However, you will still be able to produce an approximate budget which can be sent to the sponsor.
The procedure of creating the budget from the synopsis is nevertheless time consuming and error prone and it is often not ideal for a medical or clinical research professional to spend a large amount of time reading synopses and converting them to spreadsheets.
For this reason we have developed the Clinical Trial Risk Tool which has a budgeting module. A paid subscription is necessary.
Using our budgeting module, you can drag and drop either a clinical trial synopsis or the full protocol and you can select charge masters which are already inside the system, or upload your own charge master for your location.
The Clinical Trial Risk Tool uses state of the art machine learning models and AI to identify the schedule of events, extract all items from the schedule of events and reconstruct the counterpart table to the schedule of events in the budget. These items are then cross referenced to cost of procedures that were in the charge master, and a complete per-subject budget can be constructed.
Upload your clinical trial synopsis and create a budget with AI
The Clinical Trial Risk Tool knows that some costs will be in the per-subject budget or per-site budget which are not featured in the schedule of events or wider synopsis, such as the PI hours, coordinator hours, overnight stays, or subject compensation which is associated with each visit. These items are filled in by the Clinical Trial Risk Tool with the information that it has.
However, you are free to edit these items in the Clinical Trial Risk Tool and adjust the values if you know that more or fewer Coordinator hours or PI hours are required for a particular visit.
Finally, when you are happy with both the fixed costs and the per subject costs that the Clinical Trial Risk Tool has put together in its budget, and you would like to finalise the budget, you can save it in the Clinical Trial Risk Tool and export it to Excel for sharing with the sponsor or with your colleagues in the CRO.
The Clinical Trial Risk Tool uses state of the art AI to to allow a CRO to build a detailed site budget, not only from a clinical trial protocol but also from a synopsis. However, there are certain caveats: extra visits may be required in a study which will not feature in the synopsis or the protocol. Adverse events are also needed to be accounted for, and any extra invoiced items, travel, or overhead must be inferred.
You will need to confirm amounts for all these items after the Clinical Trial Risk Tool has built the skeleton budget from your synopsis.
Using the Clinical Trial Risk Tool’s AI to convert your synopsis to a detailed budget can save time and enable you to get back to doing what you are good at, namely the clinical research.
You can read more about the Clinical Trial Risk Tool in our recent white paper, follow our blog or follow Fast Data Science blog and YouTube channel.
If you have any questions or would like a feature to be implemented, please contact us.
Don’t forget that the Clinical Trial Risk Tool, in addition to calculating budgets, will also identify the risk of the trial failing to deliver informative results, which is more of a question of scientific validity of the trial. This risk assessment is useful for investigators and sponsors who would like to mitigate the risk of the trial ending without delivering informative results. You can read more about this in our publication in Gates Open Research or our recent article in Clinical Leader.

Estimating the total cost of a clinical trial before it runs is challenging. Public data on past trial costs can be hard to come by, as many companies guard this information carefully. Trials in high income countries and low and middle income countries have very different costs. Upload your clinical trial protocol and create a cost benchmark with AI Protocol to cost benchmark The Clinical Trial Risk Tool uses AI and Natural Language Processing (NLP) to estimate the cost of a trial using the information contained in the clinical trial protocol.
You can download a white paper about clinical trial cost benchmarking here Estimating the total cost of a clinical trial before it runs is challenging. Public data on past trial costs can be hard to come by, as many companies guard this information carefully. Trials in high income countries and low and middle income countries have very different costs. Clinical trial costs are not normally distributed.[1] I took a dataset of just over 10,000 US-funded trials.

Guest post by Safeer Khan, Lecturer at Department of Pharmaceutical Sciences, Government College University, Lahore, Pakistan Introduction The success of clinical studies relies heavily on proper financial planning and budgeting. These processes directly impact key factors such as project timelines, resource allocation, and compliance with regulatory requirements. The accurate forecasting of costs for clinical trials, however, is a highly complex and resource-intensive process. A study by the Tufts Center for the Study of Drug Development found that the average cost of developing a new drug is approximately $2.