On 8 October, Thomas Wood of Fast Data Science presented the Clinical Trial Risk Tool, along with the Harmony project, at the AI and Deep Learning for Enterprise (AI|DL) meetup sponsored by Daemon. You can now watch the recording of the live stream on AI|DL’s YouTube channel below:
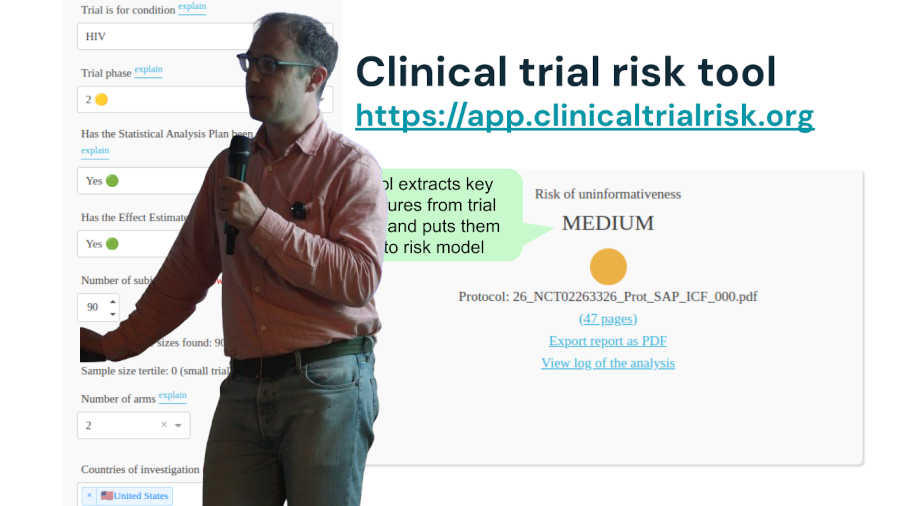
The Clinical Trial Risk Tool leverages natural language processing to identify risk factors in clinical trial protocols. The Clinical Trial Risk Tool is online at https://clinicaltrialrisk.org/tool.
Artificial Intelligence and Deep Learning for Enterprise is a meetup group in London dedicated to talks from people in the industry using developments in AI for exciting real world applications.
We initially developed the Clinical Trial Risk Tool to identify risk factors in HIV and TB protocols. Version 2 is coming soon, which will also make cost predictions (i.e. predict the cost of running a trial in dollars), and which will also cover further disease areas, such as Enteric and diarrheal diseases, Influenza, Motor neurone disease, Multiple sclerosis, Neglected tropical diseases, Oncology, COVID, Cystic fibrosis, Malaria, and Polio.
The project has been funded by the Bill and Melinda Gates Foundation and we have published a technical paper in the journal Gates Open Research:
The software is under MIT License, meaning that it is open source, and can be freely used for other purposes, both commercial and non-commercial, with no restrictions attached. The source code is on Github at https://github.com/fastdatascience/clinical_trial_risk.
[Fast Data Science]](https://fastdatascience.com/) is a leading data science consultancy firm providing bespoke machine learning solutions for businesses of all sizes across the globe, with a concentration on the pharmaceutical and healthcare industries.

Estimating the total cost of a clinical trial before it runs is challenging. Public data on past trial costs can be hard to come by, as many companies guard this information carefully. Trials in high income countries and low and middle income countries have very different costs. Upload your clinical trial protocol and create a cost benchmark with AI Protocol to cost benchmark The Clinical Trial Risk Tool uses AI and Natural Language Processing (NLP) to estimate the cost of a trial using the information contained in the clinical trial protocol.
You can download a white paper about clinical trial cost benchmarking here Estimating the total cost of a clinical trial before it runs is challenging. Public data on past trial costs can be hard to come by, as many companies guard this information carefully. Trials in high income countries and low and middle income countries have very different costs. Clinical trial costs are not normally distributed.[1] I took a dataset of just over 10,000 US-funded trials.

Guest post by Safeer Khan, Lecturer at Department of Pharmaceutical Sciences, Government College University, Lahore, Pakistan Introduction The success of clinical studies relies heavily on proper financial planning and budgeting. These processes directly impact key factors such as project timelines, resource allocation, and compliance with regulatory requirements. The accurate forecasting of costs for clinical trials, however, is a highly complex and resource-intensive process. A study by the Tufts Center for the Study of Drug Development found that the average cost of developing a new drug is approximately $2.