
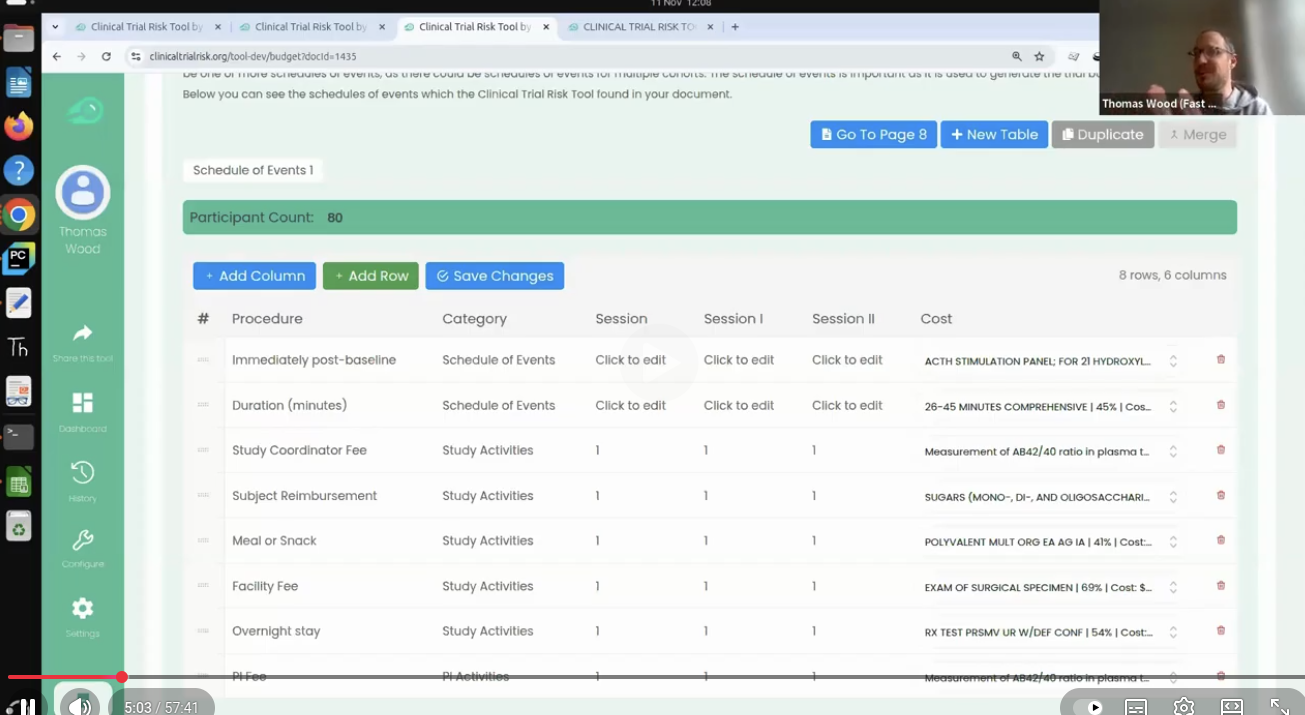
Estimating the total cost of a clinical trial before it runs is challenging. Public data on past trial costs can be hard to come by, as many companies guard this information carefully. Trials in high income countries and low and middle income countries have very different costs. Upload your clinical trial protocol and create a cost benchmark with AI Protocol to cost benchmark The Clinical Trial Risk Tool uses AI and Natural Language Processing (NLP) to estimate the cost of a trial using the information contained in the clinical trial protocol.
You can download a white paper about clinical trial cost benchmarking here Estimating the total cost of a clinical trial before it runs is challenging. Public data on past trial costs can be hard to come by, as many companies guard this information carefully. Trials in high income countries and low and middle income countries have very different costs. Clinical trial costs are not normally distributed.[1] I took a dataset of just over 10,000 US-funded trials.

Guest post by Safeer Khan, Lecturer at Department of Pharmaceutical Sciences, Government College University, Lahore, Pakistan Introduction The success of clinical studies relies heavily on proper financial planning and budgeting. These processes directly impact key factors such as project timelines, resource allocation, and compliance with regulatory requirements. The accurate forecasting of costs for clinical trials, however, is a highly complex and resource-intensive process. A study by the Tufts Center for the Study of Drug Development found that the average cost of developing a new drug is approximately $2.

Guest post by Safeer Khan, Lecturer at Department of Pharmaceutical Sciences, Government College University, Lahore, Pakistan Introduction Recent years have seen a substantial rise in oncology clinical trials, with annual growth exceeding 260 studies on average [1]. Despite this increase, these studies continue to be some of the most demanding and resource-intensive in clinical research. The combination of intensive monitoring, detailed assessment schedules, and highly specific eligibility criteria creates substantial operational challenges.

Guest post by Safeer Khan, Lecturer at Department of Pharmaceutical Sciences, Government College University, Lahore, Pakistan Introduction In recent years, the cost of conducting clinical trials has risen dramatically. This increase has posed a significant challenge for pharmaceutical companies, researchers, and healthcare innovators. According to a study published in Nature Reviews in 2017, the median cost of conducting a study was $3.4 million for phase I trials, $8.6 million for phase II trials, and $21.

Guest post by Youssef Soliman, medical student at Assiut University and biostatistician Clinical trials are the mainstay of medical innovation, but they are also notoriously expensive and resource-intensive. Funding for clinical trials comes from a wide variety of sources, yet the vast majority of funding typically comes from pharmaceutical sponsors who have the greatest stake in a trial’s success [1]. This reliance on industry funding, coupled with the immense costs of conducting trials, makes securing and managing financial support one of the top challenges in clinical research.
Thomas Wood presents the Clinical Trial Risk Tool at the Clinical AI Interest Group at Alan Turing Institute The Clinical AI Interest group is a community of health professionals from a broad range of backgrounds with an interest in Clinical AI, organised by the Alan Turing Institute. In the group’s November 2025 meeting, the talk was given by Dr Jeff Hogg, Programme Director, MSc AI Implementation (Healthcare), University of Birmingham and Clinical Innovation Officer in AI, University Hospitals Birmingham NHSFT, titled AI Readiness for Health and Care Provider Organisations.

Guest post by Safeer Khan, Lecturer at Department of Pharmaceutical Sciences, Government College University, Lahore, Pakistan Multi-Arm & Multi-Stage (MAMS) Clinical Trials Design Tips The design of clinical trials is increasingly challenged by the Rising Costs, limited availability of eligible patient populations, and the growing demand for timely therapeutic evaluation. Traditional parallel-group designs, which typically compare a single intervention to a control, are often insufficient to meet these pressures in terms of speed, efficiency, and resource utilization.
You can use the t-test when you want to compare the means (averages) of continuous data between two groups, such as blood pressure or maximum concentration of a drug in urine (Cmax). If you have data with a dichotomous outcome, you can use the Chi-Squared test instead - please try our Chi-Squared sample size calculator. The calculator below will calculate the minimum sample size for you. Your expected effect size d is the standardised effect size according to Cohen’s definition.
You can use the Chi-Squared test to analyse your trial data or A/B test data if you have two groups with a dichotomous outcome. For example, you have two arms in your trial: the placebo and the intervention arm, and your endpoint is either yes or no, such as “did the subject experience an adverse event during the trial”. The calculator below will calculate the minimum sample size for you. Your expected effect size w is the standardised effect size according to Cohen’s definition.