Coming out soon
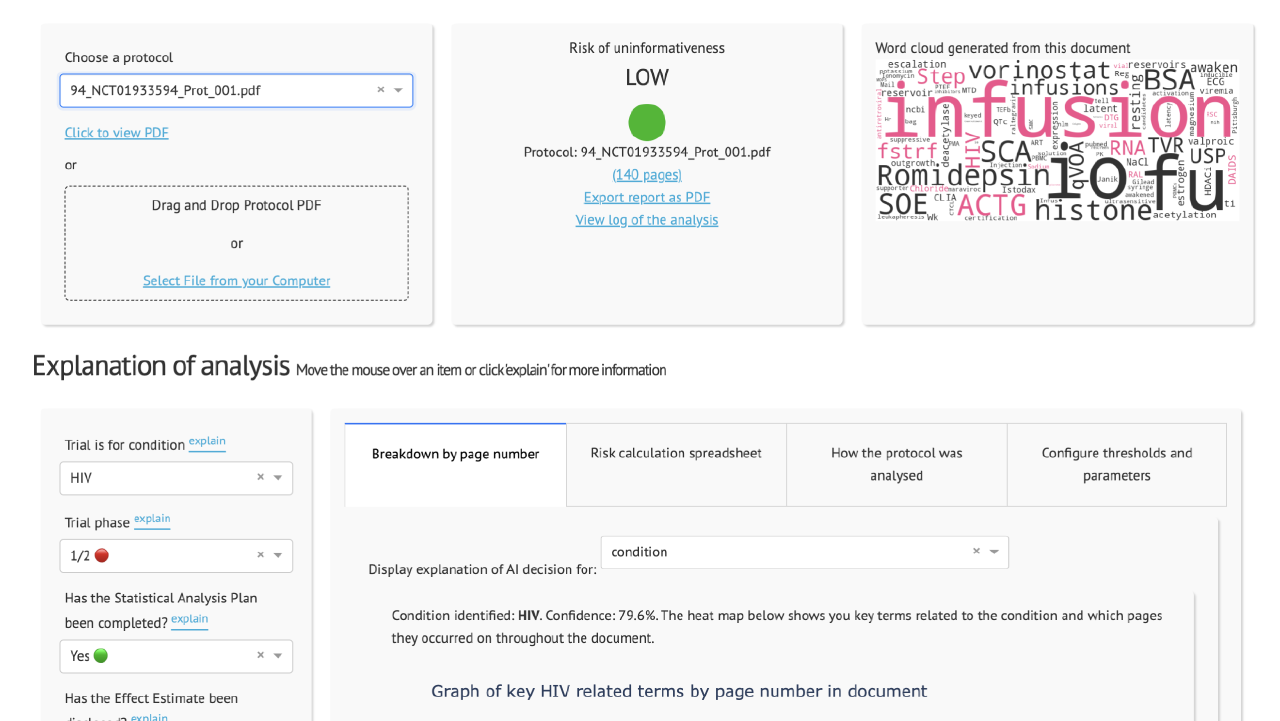
We have developed an AI tool called the Clinical Trial Risk Tool which allows a user to upload a trial protocol and which categorises the protocol as high, medium, or low risk of ending without delivering informative results.
When a pharmaceutical company develops a drug, it needs to pass through several phases of clinical trials before it can be approved by regulators.
Before the trial is run, the drug developer writes a document called a protocol. This contains key information about how long the trial will run for, what is the risk to participants, what kind of treatment is being investigated, etc.
The tool is open-source under MIT licence and it does not save any of your data.

Currently, professionals at a funding organisation read the protocols and perform a subjective assessment of the trial’s cost, complexity, and risk of ending uninformatively.
One of the most common causes of a trial ending uninformatively is underpowering. There are several indicators of high risk of uninformativeness which can be identified in a protocol, such as a lack of and or an inadequate statistical analysis plan, use of non-standard endpoints, or the use of cluster randomisation. Low-risk trials are often run by well-known institutions with external funding and an international or intercontinental array of sites. These indicators can be referred to as features or parameters.


If you would like to cite the tool alone, you can cite:
Wood TA and McNair D., Clinical Trial Risk Tool: software application using natural language processing to identify the risk of trial uninformativeness. Gates Open Res 2023, 7:56 doi: 10.12688/gatesopenres.14416.1.
A BibTeX entry for LaTeX users is
@article{Wood_2023,
  doi = {10.12688/gatesopenres.14416.1},
  url = {https://doi.org/10.12688%2Fgatesopenres.14416.1},
  year = 2023,
  month = {apr},
  publisher = {F1000 Research Ltd},
  volume = {7},
  pages = {56},
  author = {Thomas A Wood and Douglas McNair},
  title = {Clinical Trial Risk Tool: software application using natural language processing to identify the risk of trial uninformativeness},
  journal = {Gates Open Research}
}Blog

Estimating the total cost of a clinical trial before it runs is challenging. Public data on past trial costs can be hard to come by, as many companies guard this information carefully. Trials in high income countries and low and middle income countries have very different costs. Clinical trial costs are not normally distributed.[1] I took a dataset of just over 10,000 US-funded trials. You can see that the range is huge, from small device or behavioural trials costing as little as $50,000, while large multi-centre international trials can cost hundreds of millions.

Guest post by Safeer Khan, Lecturer at Department of Pharmaceutical Sciences, Government College University, Lahore, Pakistan Introduction The success of clinical studies relies heavily on proper financial planning and budgeting. These processes directly impact key factors such as project timelines, resource allocation, and compliance with regulatory requirements. The accurate forecasting of costs for clinical trials, however, is a highly complex and resource-intensive process. A study by the Tufts Center for the Study of Drug Development found that the average cost of developing a new drug is approximately $2.

Guest post by Safeer Khan, Lecturer at Department of Pharmaceutical Sciences, Government College University, Lahore, Pakistan Introduction Recent years have seen a substantial rise in oncology clinical trials, with annual growth exceeding 260 studies on average [1]. Despite this increase, these studies continue to be some of the most demanding and resource-intensive in clinical research. The combination of intensive monitoring, detailed assessment schedules, and highly specific eligibility criteria creates substantial operational challenges.